


PC850 Portable pH/Conductivity Meter Kit
December 7, 2024
Azure Aqua Vertical Gel Running System – Azure Aqua Power Supply
December 7, 2024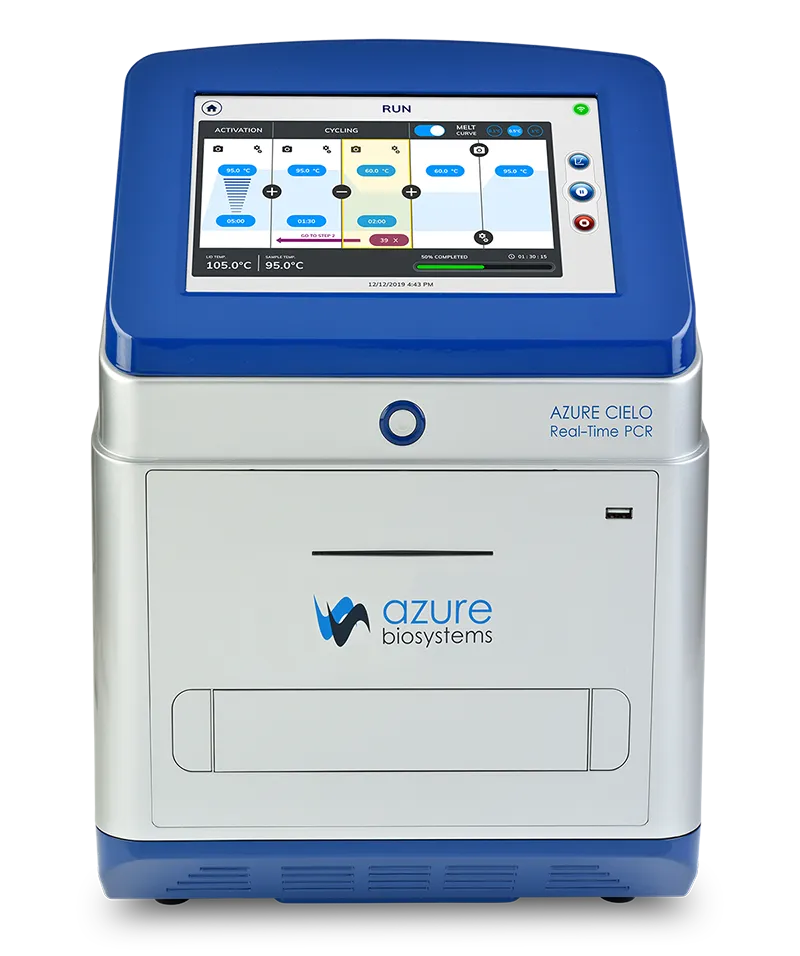
Azure Cielo™ Real-time PCR system
Related products
-
Absorbance microplate reader Ao
Description Stand-alone, filter-based 96-well plate, absorbance microplate reader Consistent Answers to a Rainbow of Assays at Your Fingertips The Ao Microplate Reader has a multitude of […]
-
Azure Biosystems – Sapphire Biomolecular Imaging
Azure Biosystems – Sapphire Biomolecular Imaging Identifyn™ currently deploys two custom-designed Azure Biosystems Sapphire FL Biomolecular Imaging Platforms. The two Sapphires allow immunocytochemistry imaging from ~300 nm to […]
-
Ao Absorbance Microplate Reader
The answers to your assays at your fingertips Assaying your 96 well plates just got easier. Designing an experiment can be hard – but using your […]


